Abstract: According to the needs of power generation system development planning, demand-side management, electricity market theory and simulation research work on time-series, interactive, and random production simulation, supported by the space foundation and method tools of intelligent engineering, according to the complex adaptive system The framework establishes a production simulation model. The model simulates the different links and functions of the power system through the user demand module, the grid enterprise dispatch module, the power market module, and the power supply enterprise production module. Using k-means clustering, integer programming, and other algorithms, the model achieves production simulation of the system. The difference between the simulated results and the actual data is within the acceptable range, which can play a supporting role in the power development planning, demand-side management, electricity market and other related analysis and research.
0 Preface
The stochastic production simulation of power system is to consider the random failure of the unit and the randomness of the power load. Through the simulation and optimization of the production operation of the generator set, the power generation and reliability indicators of the different generator sets under the optimal operation mode of the computing system are calculated. The production cost index and other algorithms [1]. At present, with the increasing resource endowment, environmental pollution and climate problems, and the large-scale development of clean energy, the need for time-series, interactive, and random power system production simulation technology has been increased. At present, there are literatures that have studied it. The literature[2] focuses on the uncertainty of renewable energy in power system production simulations. Through the multi-scenario stochastic programming theory to reflect the uncertainty of renewable energy, a stochastic programming mathematics has been established. The model simulation system runs and is solved using the Benders decomposition method. References [3] and [4] are based on sequential operations and explored a random production simulation method for comprehensive resource planning and electricity market, and presented a random production simulation based on sequence operation theory. The literature [5] incorporates energy-efficient power plants on the demand side into the research scope of production simulation and provides direction for the production simulation of two-way interaction of the power system. In [6], according to the intelligent engineering theory, an agent simulation method was used to describe the unit and the energy-efficiency power plant, and the power system production agent simulation for the operation of the energy-efficient power plant was realized, and the effectiveness was proved.
Based on the previous studies, this paper will divide the power system into several phases, ie, transmission-transmission-distribution-use. Based on the principle of complex adaptive system, the operation of the power system will be reflected by the scheduling process of both supply and demand resources, with reliability as the constraint condition. Taking into account the randomness of the power generation components, a multi-state unit can be taken into account to establish a time series production simulation model of a power system that includes conventional energy and renewable energy, and solve the model. Comparing the model calculation results with the actual data of power development, it proves its supportive role in power development planning and analysis.
1 complex adaptive system theory
Complex Adaptive System (CAS) refers to a complex dynamic system composed of two or more actors that interact according to certain rules or patterns. It has the following characteristics: (1) The complex adaptive system emphasizes the main body ( Agent's initiative, that is, Agent has its own knowledge and goals and other attributes. Due to different attributes, different Agents may show different behaviors in the same environment; (2) Complex Adaptive System considers Agents, Agents and Environments. There are interactions, influences, and feedbacks among them. The integrated results of these effects are the dynamics and causes of system evolution and evolution. (3) Different subjects form a system through certain rules and they are linked to each other in a more macro level. "Interact with other "Agent" into a new system [8]. A simple and complex adaptive system model based on intelligent engineering includes an external environment, an upper system, a coordination system, and a lower system. Here, different system levels may be a single agent or a system composed of multiple agents. Figure 1 shows a complex adaptive system in which each part consists of a single Agent.
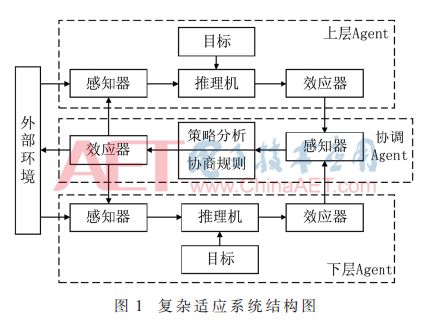
In Figure 1, the upper system and the lower system are adjusted according to their own goals according to changes in the external environment according to the knowledge base and rules; the coordination layer senses the state of the upper and lower layers, if a single target in the upper and lower layers exceeds the allowable threshold range, The coordination layer perceives changes in the state and coordinates the adjustment of the upper and lower layers, and returns the coordinated state to the upper and lower layers, making adjustments again until the whole reaches the optimal state and returns the results to the external environment, ensuring the overall goal. Or evolve in the best direction.
2 complex adaptation system production simulation model
2.1 System Model
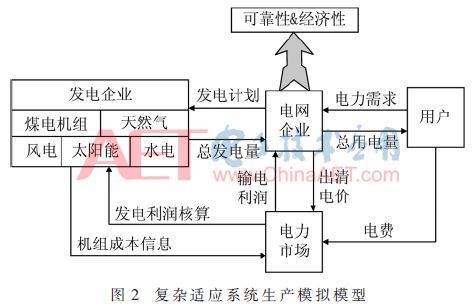
The process of power system operation is actually the supply and demand matching process between the power supply system on the supply side and the power load on the demand side. The realization of this process requires coordination among the power generation companies, grid companies, the electricity market and users. Therefore, a power system production simulation model based on a complex adaptive system is composed of four modules that simulate the power system functions: a power generation enterprise module, a power grid enterprise module, a power market module, and a user demand module. The structure is shown in FIG. 2.
2.1.1 User Requirements Module
The user demand module exists as the external environment function that other modules need to adapt to, emulating the characteristics and laws of electricity users. Its core function is to provide power load demand information for other modules according to the need of production simulation. The change of user demand module is the power for system development and the purpose of other modules to produce production behavior.
The production simulation in this paper takes hour as the time scale, and the simulation target period is 8760 hours in the whole year as the simulation cycle. According to the functional requirements of the model, the formula for calculating the characteristics of the electrical load changes is as follows:
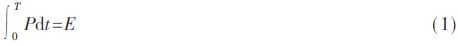
Among them, E is the predicted electricity quantity; P is the load at each time point, P=α×Pmax, Pmax is the maximum load of the system, α is the standard value of the load. Separating the maximum load and load characteristics makes it easy to analyze power systems with different periods or time spans.
2.1.2 Power Production Module
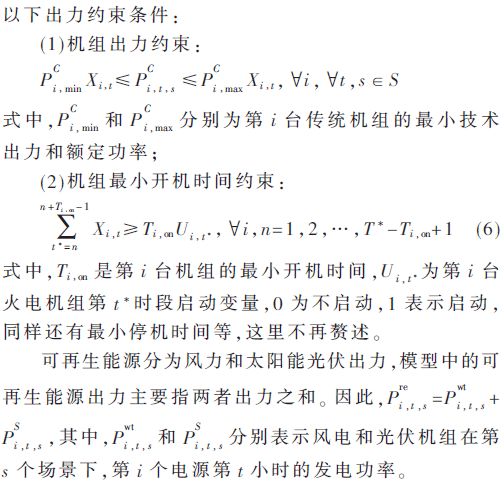
The power production module simulates different generator sets including: thermal power, hydropower, natural gas, wind power, photovoltaic and nuclear power. Its main function is to calculate and adjust the power generation cost of different units and send the results to other modules; it is generated based on renewable energy characteristic information. Its hourly output status; the final production simulation according to the power generation plan, calculation of pollutant emissions, renewable energy abandonment rate and other indicators. The specific principles for calculation and adjustment of unit quotes are as follows:
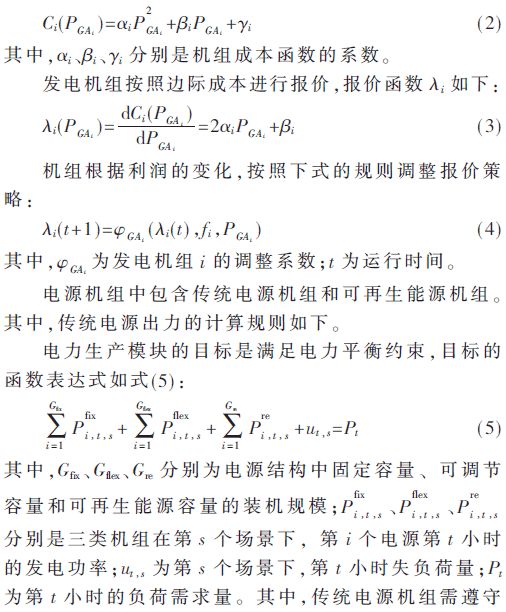
The hourly cost function of genset i is expressed as a quadratic function:
(1) Wind power
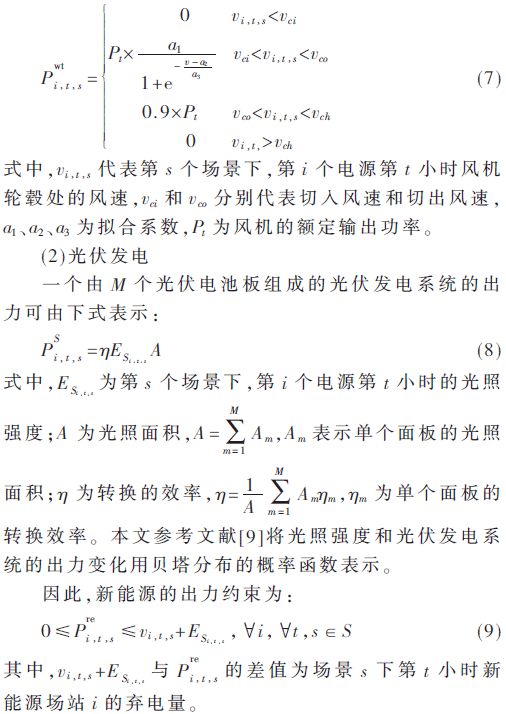
The output of wind power is random. This paper uses the Weibull distribution of two parameters to describe the probability density of wind speed. The output of the wind turbine is mainly determined by the wind speed at the hub height of the wind turbine. The specific relationship is:
2.1.3 Grid Dispatching Module
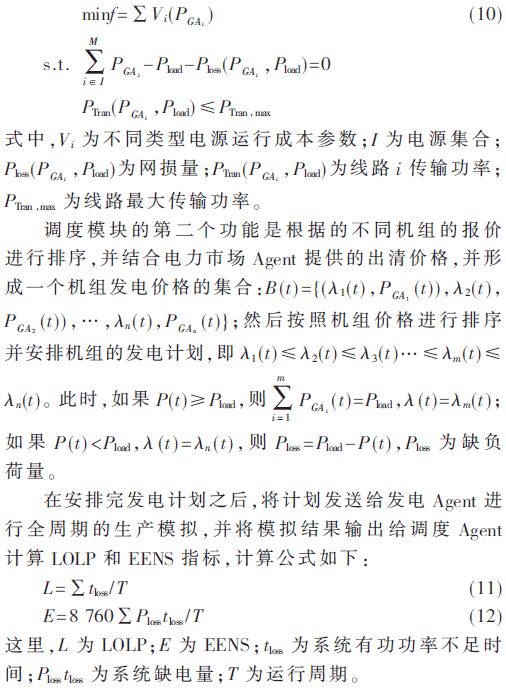
The grid dispatch module aims at minimizing carbon emissions or minimum operating costs. According to the clear price calculated by the power market module and the scale and quotation of the machine assembly machine shared by the power production module, according to the load information, the power supply and demand situation is calculated, and the power generation plan is arranged; For the grid constraints, the Loss of Load Probability (LOLP) and the Expected Energy Not Served (EENS) are calculated during the time period T. The formula is as follows:
2.1.4 Power Market Module
The function of the power market module is to calculate the power clearing price and simulate the power auxiliary service market to generate a unit outage probability matrix. In a balanced trading market that does not consider network constraints, users are aiming to minimize the cost of electricity purchase C, that is,
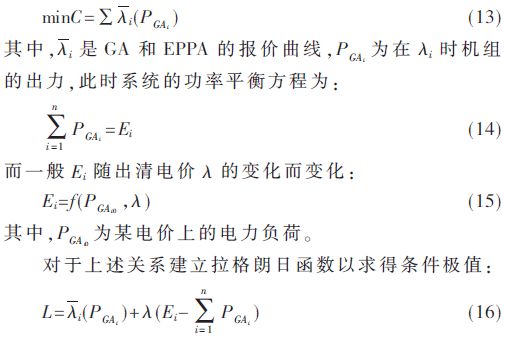
The derivation of the Lagrangian multiplier λ as the minimization condition for the purchase cost of the user is
Solve it together with the power balance equation to obtain the system's market clearing price and the power generation output of each power producer.
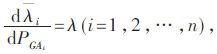
In the electricity auxiliary service market, taking into account the forced outage of conventional units, the operation status of the unit is firstly sampled during simulation, and then the random forced outage is similarly simulated through multiple simulation system operations. The objective functions are as follows:
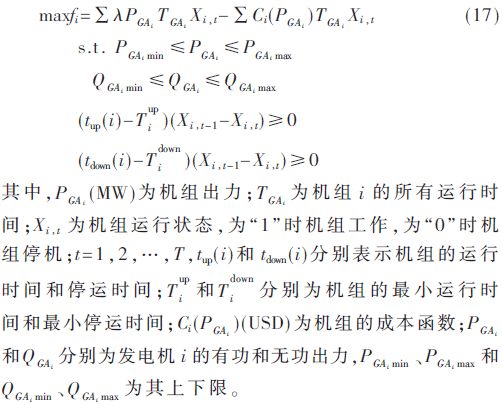
The calculation process of the above model is shown in Figure 3.
3 Example Analysis 3.1 Data and Related Parameter Settings
The model is implemented in Java and Python programming. In order to simplify the calculations, the maximum load, load demand, renewable energy output characteristics, and initial size of different units need to be set in the simulation input data, cost parameters, subsidy parameters, emission factors for power production, and unit operation. Hours, etc. are considered constant.
3.1.1 Wind Output Data
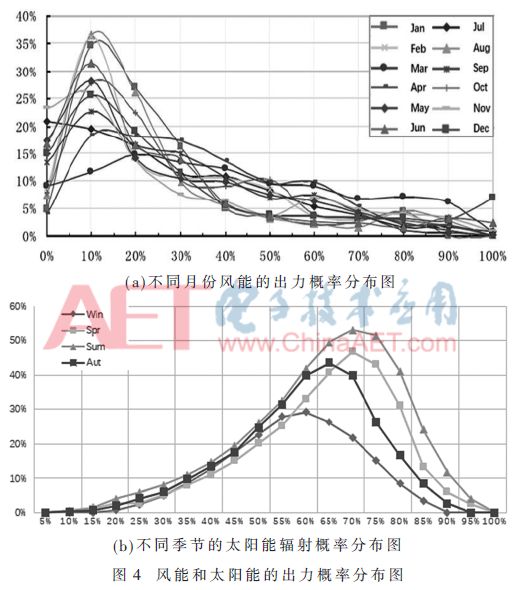
From the perspective of statistics, this article collects wind and solar energy statistics and historical data from different regions, and establishes a wind and power output model. According to the statistical results of the data, the horizontal axis of the coordinate axis is the output level of renewable energy, and the vertical axis is the corresponding probability of the output level. The monthly output characteristics of the simulated wind/solar energy simulation are shown in Figure 4.
3.1.2 Production Simulation Data
The types of power supply units considered by the model include: hydropower, coal, natural gas, nuclear power, wind power and solar energy. According to China's electricity structure in 2016, its net power generation capacity was 5,974.7 billion kwh, and its total installed power generation capacity was 165.051 million kilowatts, of which 94.624 million kilowatts were for coal, 70.11 million kilowatts for gas and 33.07 million kilowatts for hydropower. There were 147.47 million kilowatts of wind power, 33.64 million kilowatts of nuclear power, and 73.63 million kilowatts of solar energy.
3.2 Calculation Results
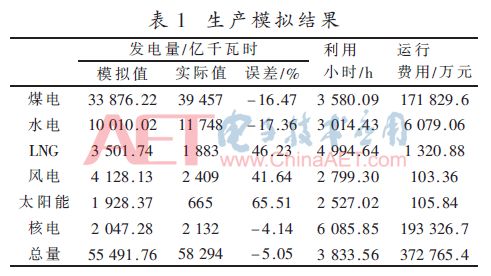
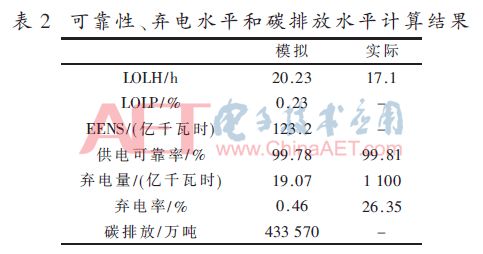
Under the 2016 installation structure, the comparison of the annual power generation and annual utilization hours of different types of units with the actual values ​​and the annual operating costs are shown in Table 1. Table 2 shows the results of the comparison between reliability indicators and actual conditions such as load-loss hours, loss-to-load rates, abandoned electricity, and abandonment rates of production simulations.
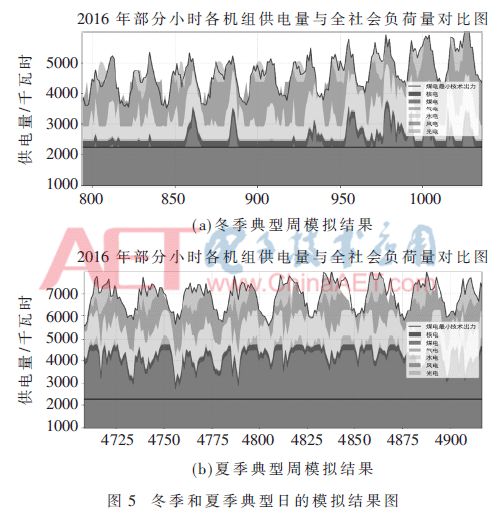
The 8 760-hour production simulation under the power installation structure in 2016 and the results of the typical weekly simulation results for winter and summer are shown in Figure 5.
3.3 Analysis of results
The relative error between the simulation result and the actual annual power generation is about -5.05%, and the relative errors of thermal power, hydropower, natural gas, wind power, solar energy and nuclear power are -16.47%, -17.36%, 46.23%%, 41.64%, 65.51%, respectively. -4.14%. At the same time, according to the “China Electric Power Industry Annual Development Report 2017â€, the average time per household outage in 2016 was 17.11 hours, and the reliability of power supply was 99.81%; and the annual power outage time in production simulation results was 20.23 hours, and the reliability of power supply was 99.78%.
According to the results of production simulation, coal-fired power plants still dominate the current system, and coal-fired power output accounts for more than 50% of the total. The abandonment of renewable energy is largely due to the surge in renewable energy output during the low-load period, while other conventional power supply output has been reduced to a minimum technical output and cannot provide enough room for renewable energy. The reason for the loss of load is due to the lack of renewable energy output at the peak of the load. Even if all the conventional power output is increased to the maximum, it still cannot meet the power demand.
The simulation results reflect several features of the current power supply structure: (1) Coal power is the main power output form in the current power structure; (2) The peak-to-valley power demand difference is large and the system flexibility is insufficient, and it is difficult to rely solely on adjustments. The power output scale meets the power demand; (3) The traditional power supply has a relatively large fixed capacity. When the load demand is low, it will occupy the space occupied by renewable energy sources, resulting in abandoning renewable energy.
4 Conclusion
In this paper, the power system production simulation model is established based on the theory of complex adaptive systems, and the relative error of the model's power generation and actual power generation is verified to be about 4.71% under the power supply structure in 2016. According to the results of the model solution, it can analyze the power generation, pollutant emissions, power system economics, power supply reliability, and renewable energy utilization efficiency of different types of units that meet the power demand given the power supply structure. prediction.
In addition, this study still needs in-depth work as follows: refine user requirements and power grid enterprise modules, consider the characteristics of power load diversity, introduce the analysis of power network security operation characteristics; deepen the power market module, enrich the power market trading mechanism; and power enterprise modules The selection of different units in the single strategy, multi-scenario approach to simplify the rationality of simulation of renewable energy generation also needs further demonstration.
Inverter 12V,Inverter 4000W 12V,Portable Mini Inverter 12 V,Solar Power Inverter 12V
GuangZhou HanFong New Energy Technology Co. , Ltd. , https://www.gzinverter.com