When we are engaged in electrical work, it is inevitable to look at pictures, but for many novices, there always seems to be a messy feeling at the beginning. After we walked over, we learned that we just didn’t understand these rules at the time. Take the electronic circuit diagram as the main example to summarize. The reason why the electrical circuit is not illustrated is because there are more integrated components in the electrical circuit, and the circuit diagram is relatively clearer. We may find that a certain integrated block has a problem, and then replace it. (Usually in order not to delay production, the first task is to resume production), but if there is a problem with this block, it will be handed over to the relevant department of the manufacturer to repair it. Of course, it is not ruled out that the electrician of the enterprise will repair it by itself. . Turning back to the topic, what I shared today is mainly aimed at the basic population, and I hope it will give you a sense of clarity.
Circuit diagram trend
Refers to the arrangement direction of each part of the circuit in the circuit diagram from the initial input terminal to the final output terminal. The most common circuit diagram is from left to right, that is, each unit circuit of signal processing is arranged in the direction from left to right. Some circuits also use a top-to-bottom arrangement.
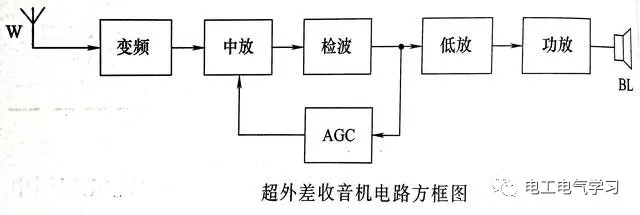
For example, the picture above: the wireless signal is input from the left antenna W, from left to right through frequency conversion, middle amplifier, detection, low amplifier, power amplifier, and finally the sound is output from the speaker BL. But the AGC (automatic gain control circuit) in the figure is used as a feedback circuit, and its direction is from right to left. In other words, as part or all of the output signal, the feedback circuit returns to the input end, and its direction is opposite to that of the main circuit.
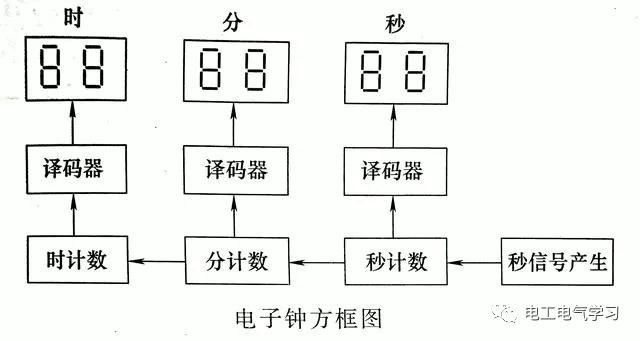
For some complex circuit diagrams, for some reason, when the above-mentioned rules are generally met, some circuits also have reverse arrangements, but arrow symbols are usually used to indicate the direction of the circuit. As shown in the figure above: In order to symbolize people's time arrangement habits of "hours", "minutes" and "seconds", a circuit diagram from left to right and bottom to top is used, which is relatively rare.
The orientation and drawing method of graphic symbols
The graphic symbols of the circuit diagram in the national standard only give a basic figure, but we can change the orientation and drawing position of these graphic symbols according to specific needs in actual use.
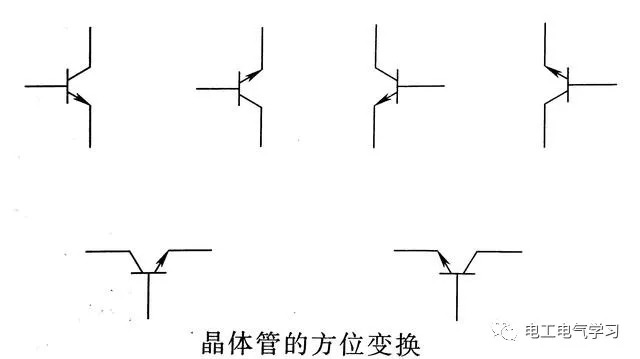
The orientation of the graphic symbols of the components can be placed according to the drawing needs, either horizontally or vertically; it can face up or down; it can also be rotated or mirrored. The symbol of the NPN transistor as shown in the figure above.
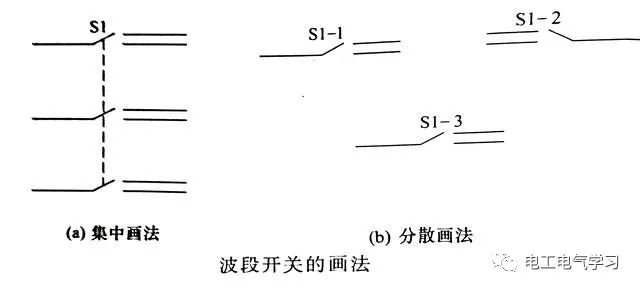
Some components include several components. In the circuit diagram, centralized drawing and scattered drawing can be used as needed. As shown in the figure above: the band switches can be drawn together as shown in Figure a and connected by dotted lines to indicate linkage; or as shown in Figure b, they can be drawn near the circuit they control with the text symbols "S1-1" and "S1-2" "S1-3" means.
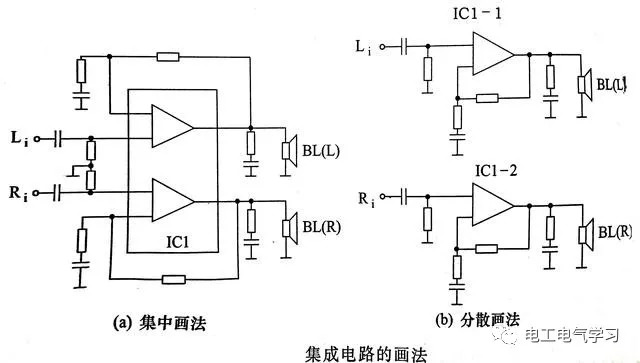
Some components contain many independent units, especially integrated circuits, such as the bi-amp integrated circuit in the above figure. Figure a is a concentrated drawing method, and Figure b is a scattered drawing method. Generally speaking, the simpler circuits mostly use the centralized drawing method, and the more complex circuits use the scattered drawing method.
State of operable components
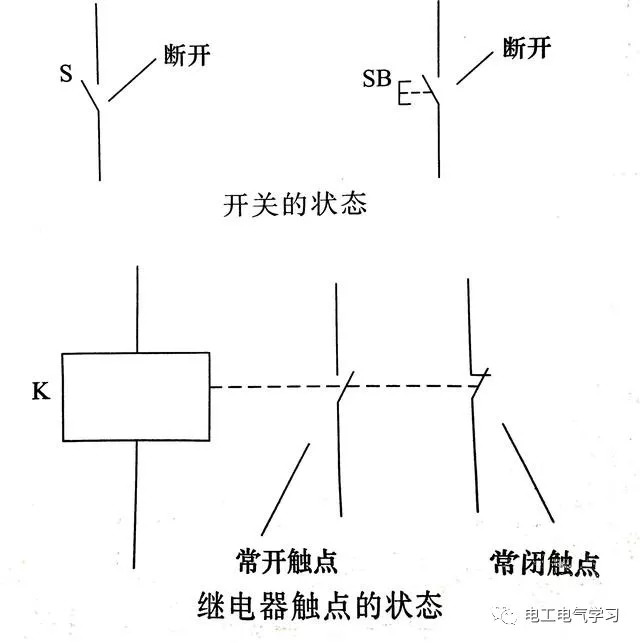
Like switches, relays, etc., there are operability devices with movable parts, and the circuit diagrams all show their working status when they are not operating. As shown in the figure above, the switch is in the open state, the normally open contact of the relay is in the open state, and the normally closed contact is in the closed state.
Integrated circuit drawing
The internal circuit of an integrated circuit is generally very complicated, including several units and many components, but in circuit diagrams, the integrated circuit is usually only regarded as a component. Therefore, almost all circuit diagrams do not draw the internal circuits of integrated circuits, but are represented by square or triangular frames.
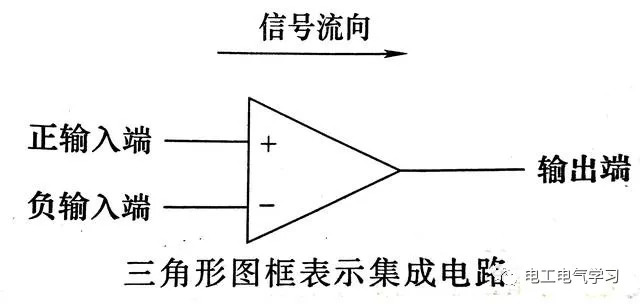
Integrated operational amplifiers, voltage comparators, etc., are traditionally represented by triangular frames. As shown in the figure above, there are positive and negative input terminals on the left side, and the output terminal at the apex of the triangle on the right side. The apex direction of the triangle frame is the signal flow direction.
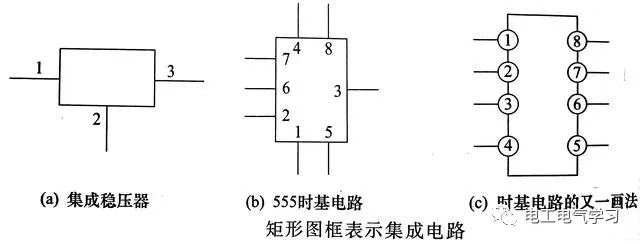
As shown in the figure above, the integrated voltage regulator, time base circuit, etc. are conventionally represented by rectangular frames, and each terminal is marked with a pin number. The pin numbers can be marked outside the frame, inside the frame, or on the rectangular frame. The pin numbers can be arranged in order or out of order. The vast majority of other types of integrated circuits are represented by rectangular frames.
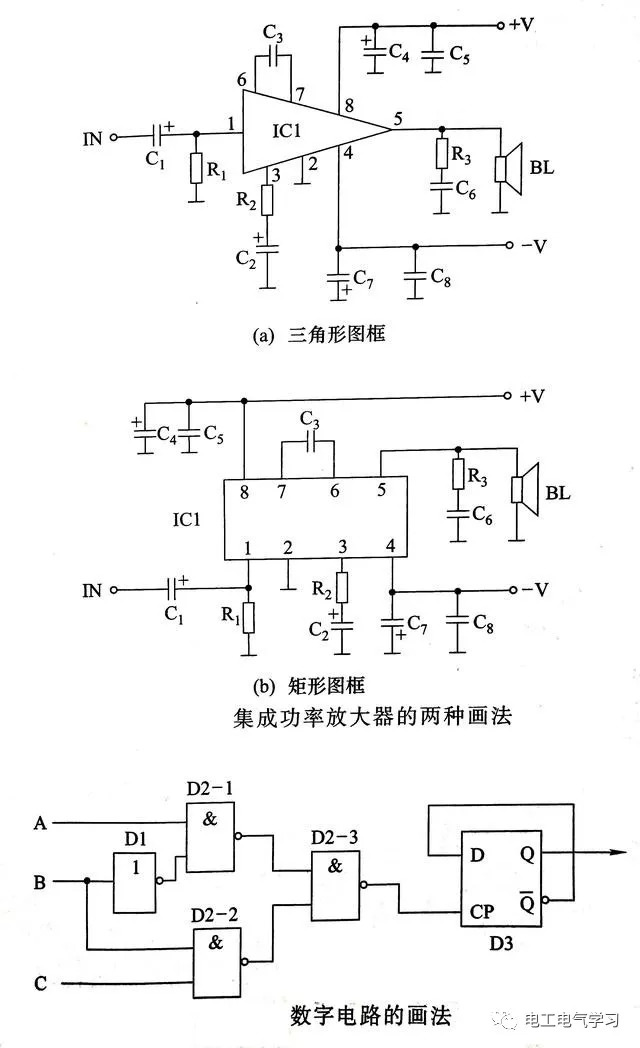
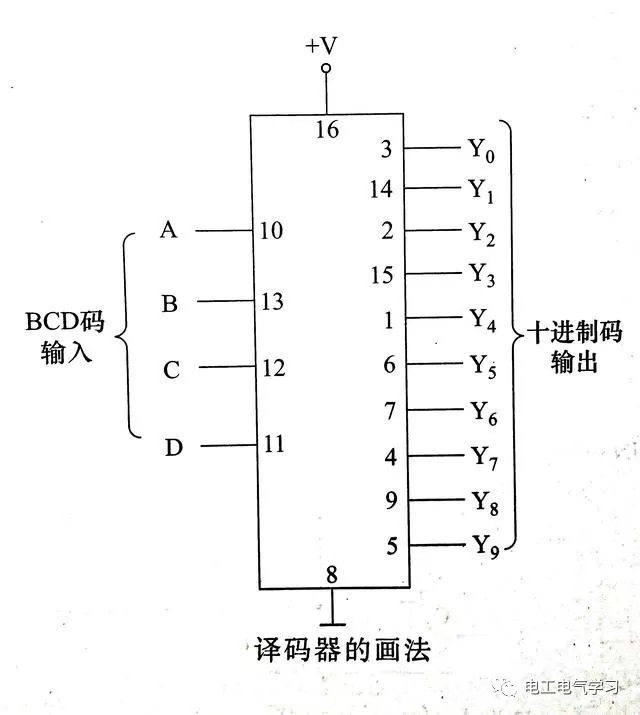
As shown in the figure above, integrated voltage amplifiers, integrated power amplifiers, etc., can be represented by triangular frames and rectangular frames, but the amplifiers are represented by triangular frames, and the signal flow is more intuitive. Digital integrated circuits generally use the scattered drawing method, which is directly represented by logical graphic symbols, and gate circuits, flip-flops, etc., all use this drawing method. Other digital integrated circuits are still more often represented by rectangular frames, and the logical function text symbols of the pins are marked at each pin, such as the decoder in the following figure.
Representation of connecting wires
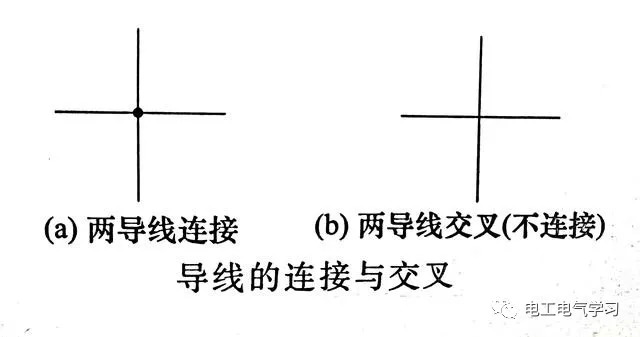
The connecting wires between the components are represented by solid lines in the circuit diagram. In Figure a, there is a dot at the intersection of the two wires, indicating that the two wires are connected together; in Figure b, there is no dot at the intersection of the two wires, which means that the two wires cross but are not connected.
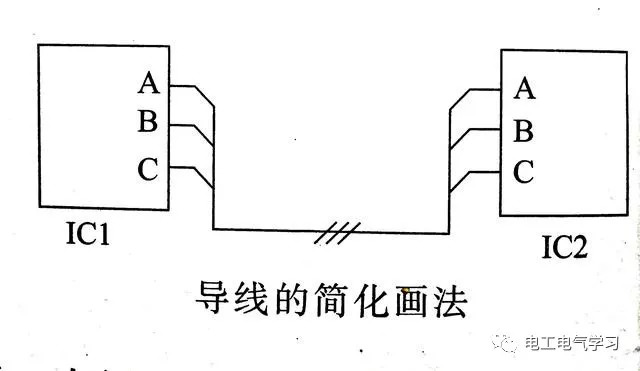
The connecting wires can be drawn in a simplified way. As shown in the figure above, there are 3 small slashes on the connection between IC1 and IC2, which means that there are 3 wires connecting A and A, B and B, and C of IC1 and IC2 respectively. Connected with C, but the three wires are not connected.
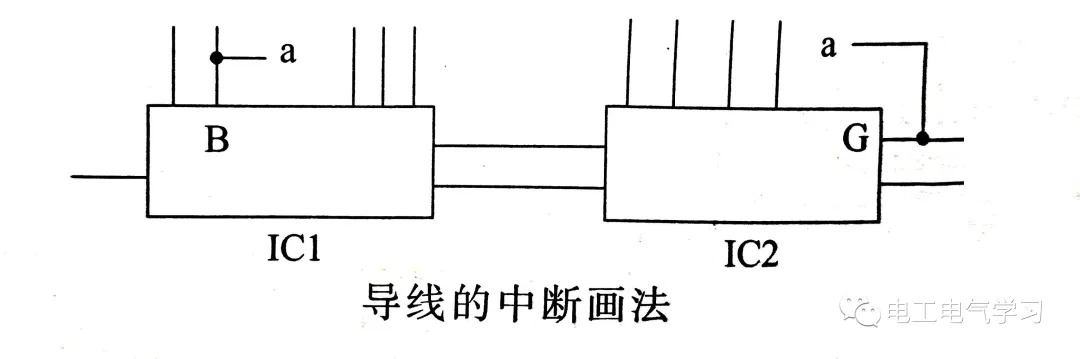
When the two ends of the connecting wire are far apart and there are more graphic areas in the middle, the drawing method of interrupting and marking can be adopted. As shown in the figure above, the connecting wire between IC1's B terminal and IC2's G terminal adopts the interrupt drawing method, and the two ends of the interrupt are marked with the same mark "a". When we analyze the circuit diagram, it is understood as two " There is a connecting wire between the "a" ends.
Representation of non-electrical connection
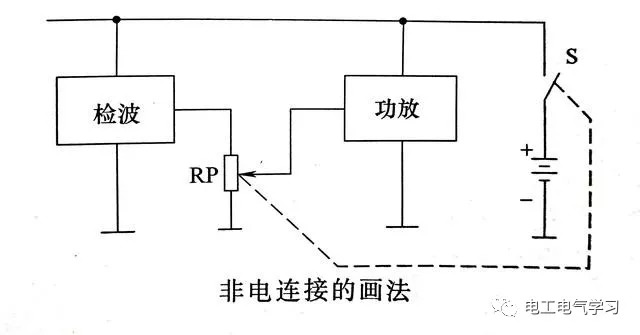
Some components have mechanical connections, which are shown on the circuit diagram with dashed lines. As shown in the figure below, the dotted line connects the potentiometer RP with the switch S, indicating that the power switch is controlled by the rotary shaft of the volume potentiometer. They are a linked potentiometer with a switch.
Representation of power cord and ground wire
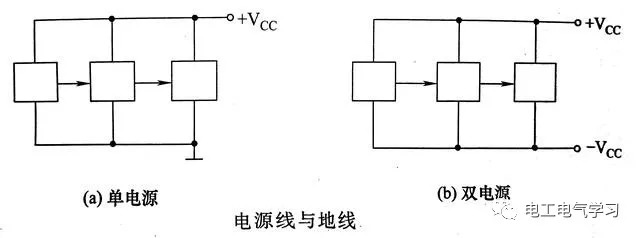
Usually, the positive power lead in the power cord or dual power supply is arranged above the component, and the ground wire or the negative power lead in the dual power supply is arranged below the component.
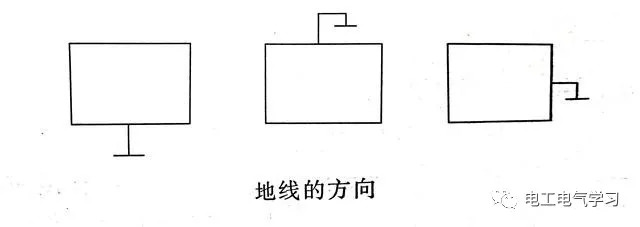
Under normal circumstances, the grounding symbol is drawn downward, but sometimes it is required on the drawing layout, and it can also be drawn upward, left, or right.
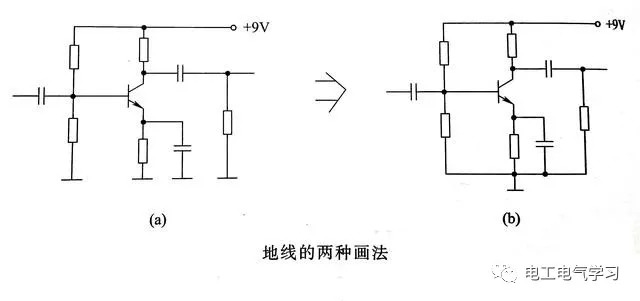
More complex circuits often do not connect all ground wires together, but instead use isolated ground symbols.
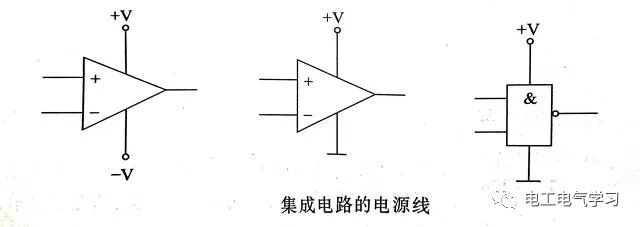
Usually, the power lead of the integrated operational amplifier is not drawn in the circuit diagram, because this does not affect the circuit analysis function, but the power lead should not be forgotten when analyzing the power circuit and actual production.
Bimetallic thermometer combines two metals with different linear expansion coefficients, and one end is fixed. When the temperature changes, the thermal expansion of the two metals is different, which drives the pointer to deflect to indicate the temperature. This is bimetallic sheet thermometer, as shown in the figure on the above page. The temperature measurement range is - 80 ~ 500C, which is suitable for temperature measurement when the accuracy requirement is not high in industry. As a temperature sensing element, bimetallic sheet can also be used for automatic temperature control.

Bimetal Thermometer,Marine Bimetal Thermometer,Bimetallic Thermometer For Marine Pipeline,Bimetallic Thermostat Thermometer
Taizhou Jiabo Instrument Technology Co., Ltd. , https://www.taizhoujbcbyq.com